
A simple guide to interviews thematic analysis


Let’s define the problem: you just finished interviewing a good number of users, around 10-15. You need to make this data useful but don’t know where to start. Unsurprisingly, getting insights from any qualitative data can be tedious.
This short guide might help you with that. It is not the ultimate guide, and it’s a brief step-by-step instruction on how I generally approach the task of finding insights in a pile of quantitative data. I wanted to make it as simple as possible so it is linear and not that detailed.
Step -1. Prepare the data
It is essential to have your interviews recorded and transcribed. Don’t rely on your memory. Use tools to convert audio to text, or do it manually if tools don’t work. Details are important.
Step 0. Discuss goals and research hypotheses
Always start any activity with the goal, the outcome you want to achieve, and hypotheses to verify. If you have other stakeholders involved, gather together and discuss the expectations. Also, ask how the insights will be utilized in the future. Even if you didn’t set the goals before you started the interviews, it’s never too late.
Step 1. Read through all the interviews once again
Skimming through the interviews can help you to refresh everything in your mind. Involve other team members at this stage, and give them a few transcripts to read. Discuss what they find insightful in a separate meeting.
Step 2. Color code each interview
There are different approaches to categorization, and I use a very straightforward one. As we analyze humans, usually their answers can be divided into these categories:
Goals (color code in cyan)
Behavior and actions (color code in blue)
Gains (color code in green)
Pains (color code in red)
Improvement suggestions (color code in grey)
You can also involve your team in this stage. Give each teammate a couple of participants’ transcripts to analyze. Discuss the results.

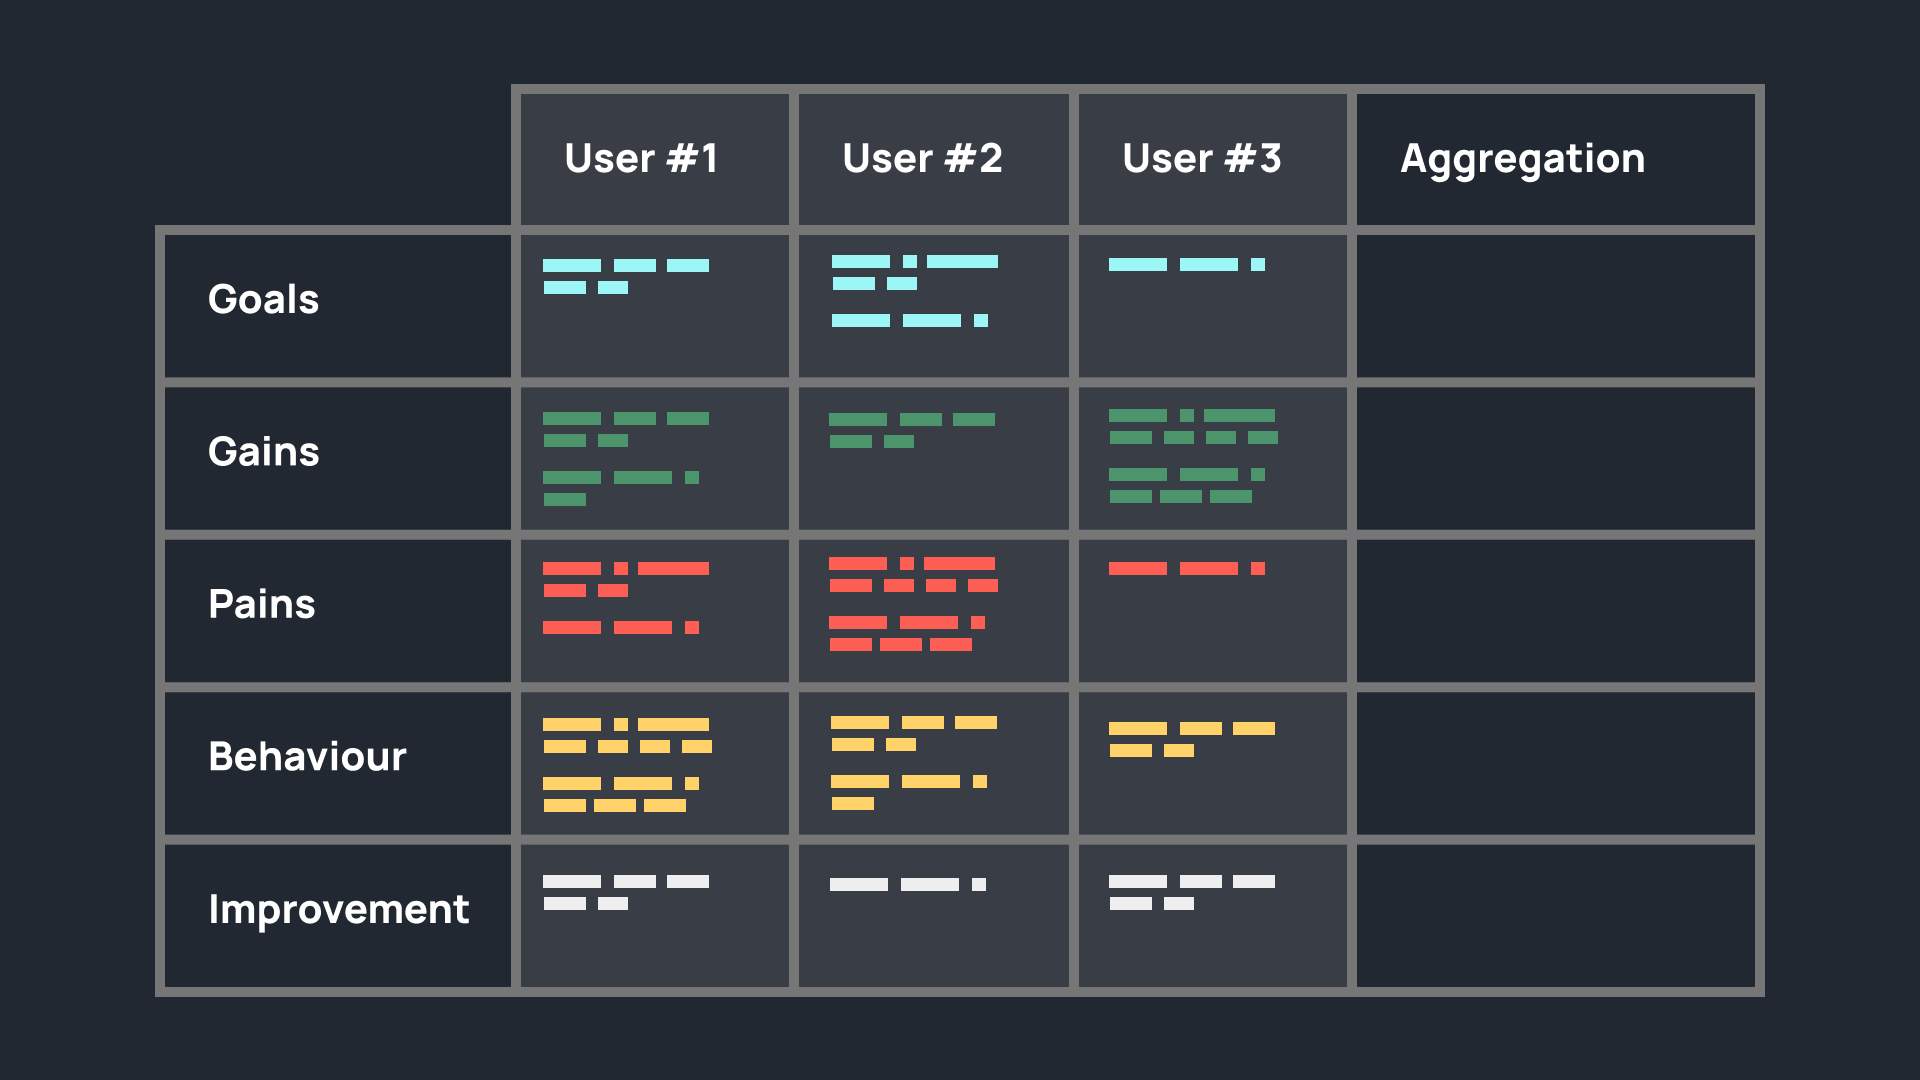
Step 3. Transfer all highlighted texts to the User Profile Canvas
User Profile Canvas is a great tool I found in the ‘Collaborative product design’ book by Austin Govella. Create UPC for every interview, and move your color-coded data accordingly.

Alternatively, you can try Tables in Notion. Use rows for categories and columns for participants. Also, add aggregation and insights columns; you will need them later.
Step 4. Merge User Profile Canvases
Take the first canvas, and merge the next one with it. If you see repeated stickers, pile them up, don’t delete them. Then do it with other canvases one by one. In the end, you’ll have a master User Profile Canvas with many piles. Give each pile of stickers a name that will be a theme.

If using a table in Notion, open each category page to see the aggregation for every participant. Add common themes in the aggregation column.

Step 5. Take a break
You will find more patterns and new insights when you look at your data with a fresh mind.
Step 6. Discuss the themes with the team
Use time with your team to critique your themes and develop new insights. The question to check is, ‘Is there enough data to support the theme?’.
The conclusion
There is no single best approach to thematic analysis, and everything depends on the amount of quantitive data you have and your needs. If you want to dive deeper into this topic, I recommend reading the guide by Norman Nielsen.
However, when the thematic analysis process is straightforward, it’s an excellent tool to invite other team members to collaborate. Good team collaboration increases alignment and improves the quality of insights of the research.
Moreover, a bunch of tools can help you streamline your user research processes, like Dovetail or Codens. I have never used them, and I like the flexibility of Notion and other tools because my approach differs from project to project. But I will give them a try.
Wow! I have to say I can’t wait to read more of this type of content 🔥🔥🔥